geoStates
an open-source package for plotting choropleth maps
geoStates is an open-source Python package for plotting choropleth maps of the United States. It was originally created as a way to reduce the amount of customizations/steps required to display all of a shapefile’s states in the same plot window.
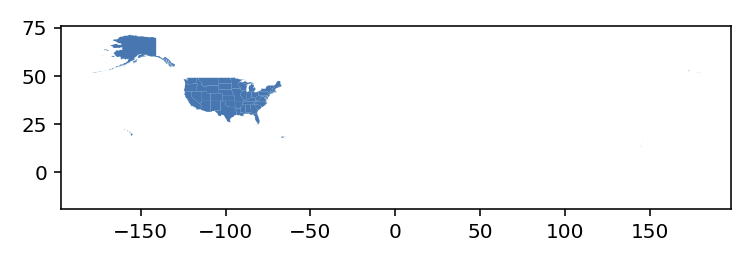
The figure below shows the output of calling .plot() on a shapefile from the U.S. Census Bureau:

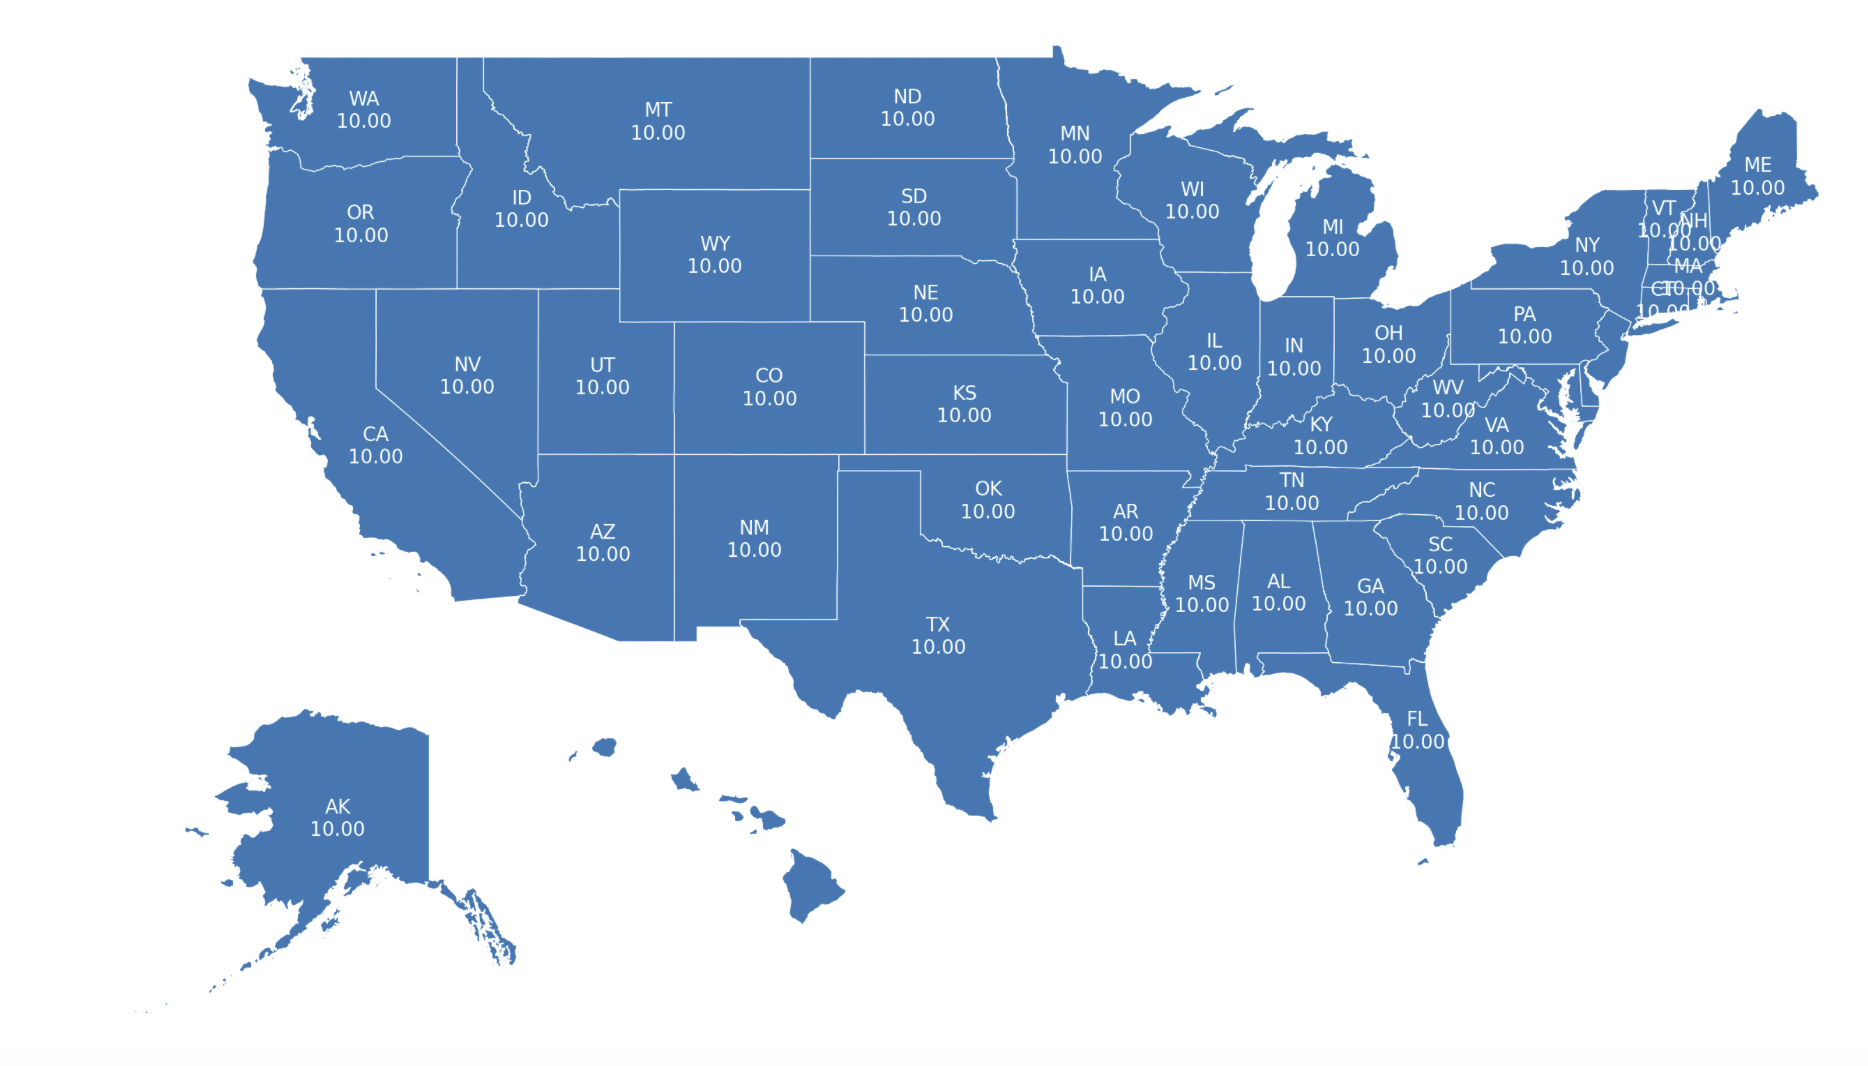
As shown above, the shapefile contains a set of multipolygon objects that are all located in their geospatially accurate positions. While this is geographically correct, it is not very helpful for visualization. Most maps of the United States move Alaska and Hawaii to the lower left part of the plot. This package addresses this issue.
This package was also partly inspired by the spirit of the quote below:
Every good work of software starts by scratching a developer’s personal itch
– Eric S. Raymond, The Cathedral and the Bazaar (Chapter 2, page 23)
After moving the multipolygons for Alaska and Hawaii to the lower left, the new plot looks like this:

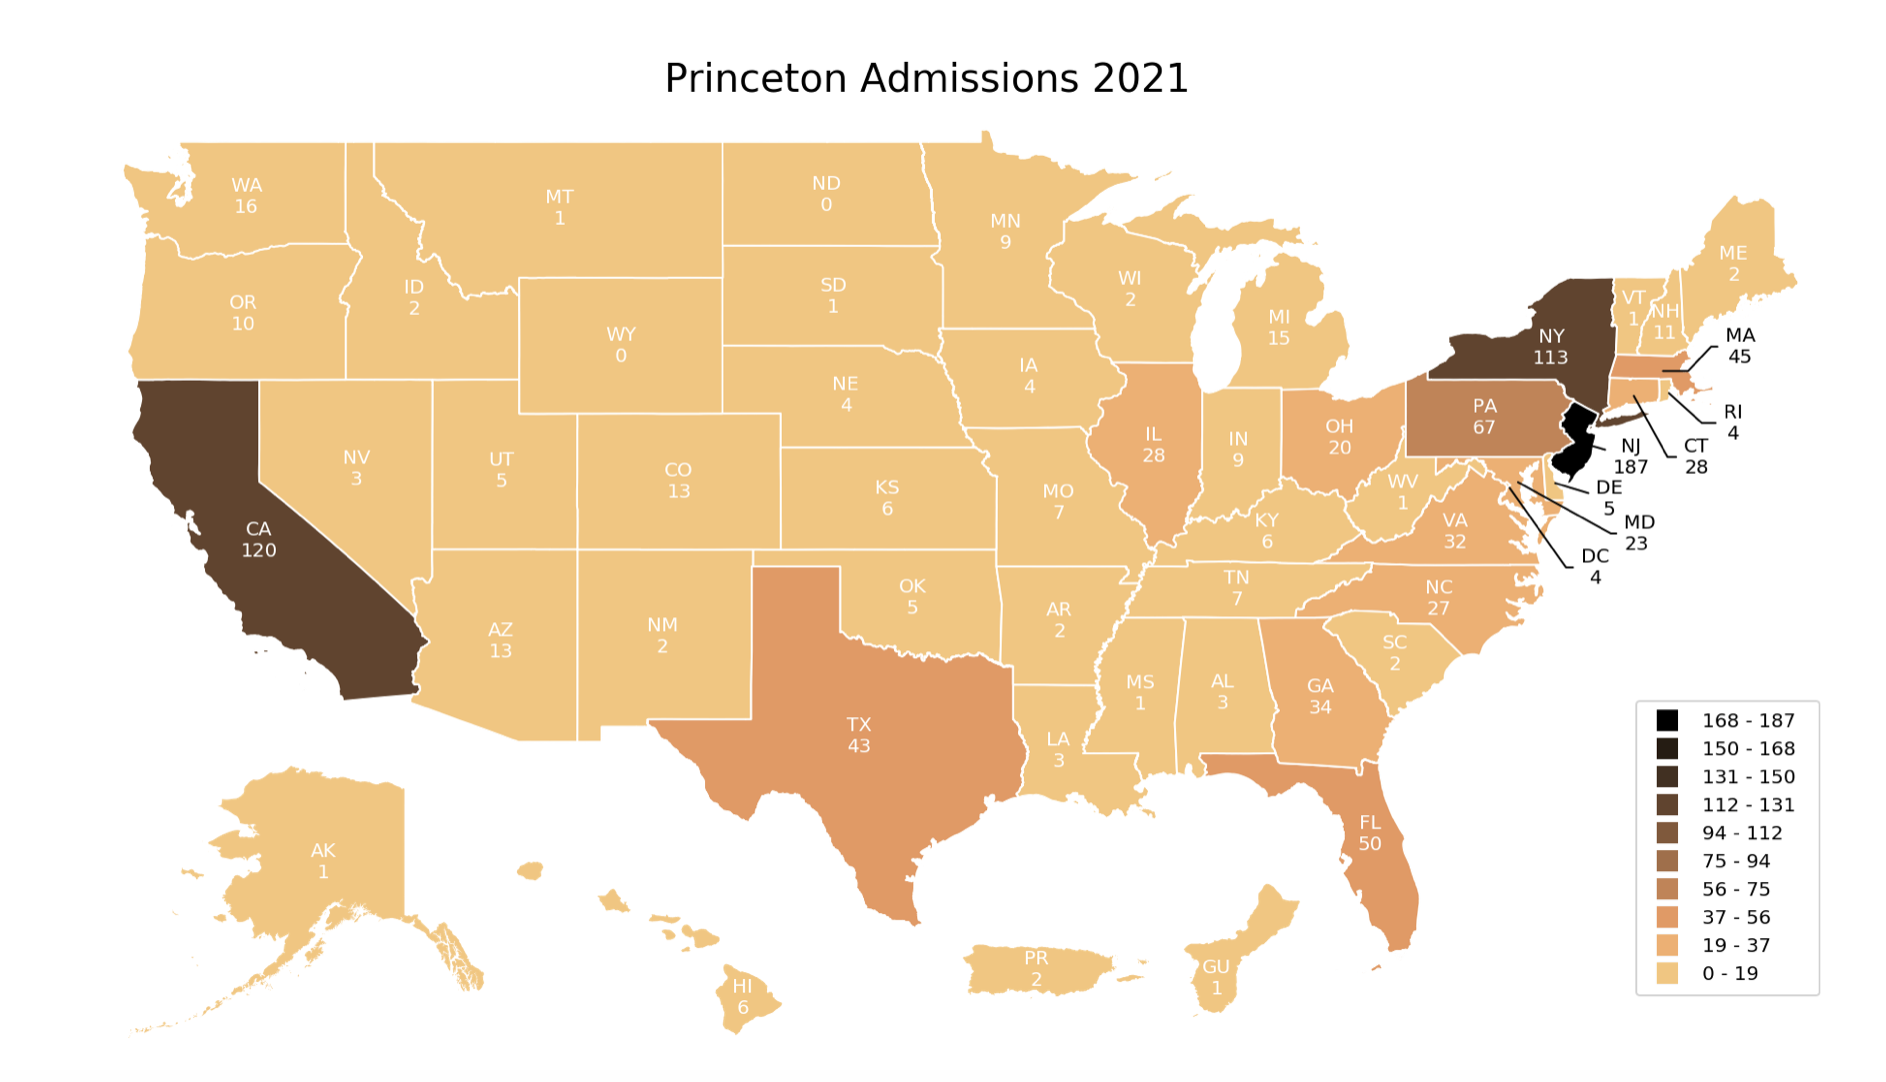
The primary goal of this package was to simplify the process of creating high-quality choropleth maps in Python. In order to make this process as straight forward as possible, the API was designed to contain a plot_states() function that takes in a dataframe (merged with data that you would like to plot) and various aesthetic tuning parameters.
As an example, the code below generates the proceeding plot:
# call the plot_states() function
plot_states(data, column='admits', extra_regions=True, cmap='copper_r', labels='both',
            linestyle='none', legend='lefend')

# add a title to the plot
plot.annotate('Princeton Admissions 2021', xy=(-97, 50.5), fontsize=18, ha='center')

If you would like to learn more about geoStates and how it works you can visit its documentation page. If you would like to install geoStates directly (without using pip install geostates), you can visit its GitHub page or PyPI page.